Latency signals: see when one price source is still quoting the old price
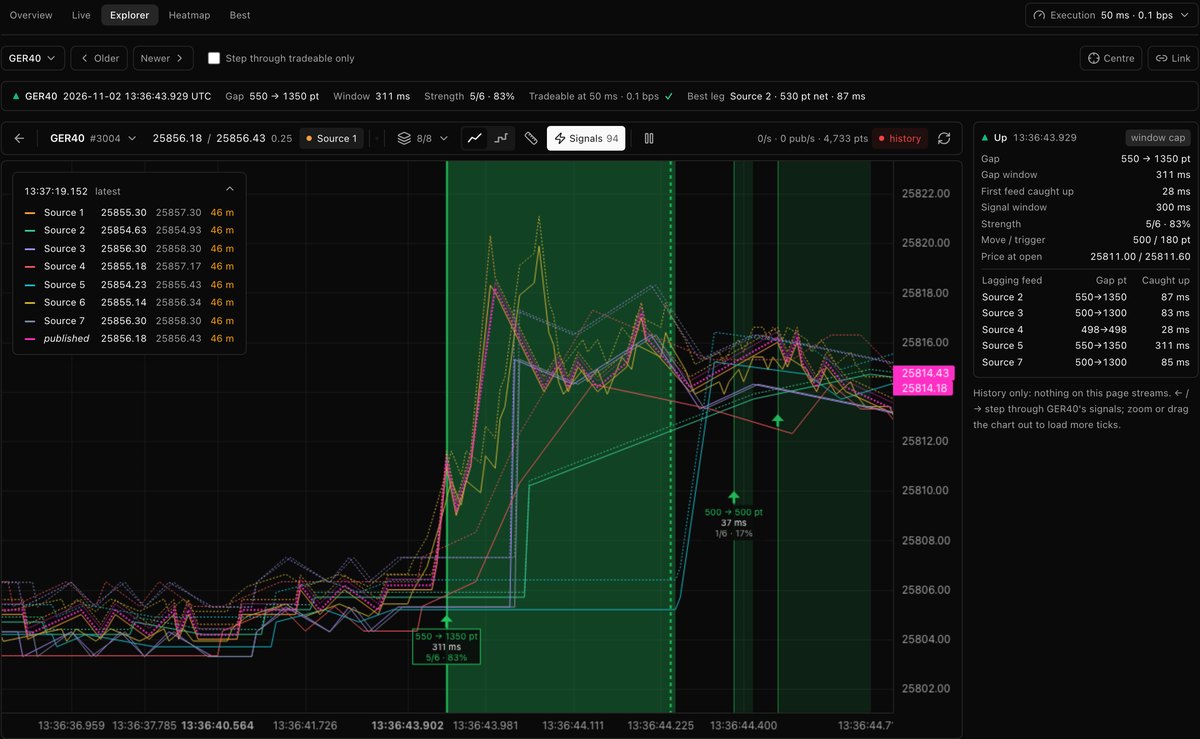
A new Signals section shows, live and for the last 30 days, every moment one of our price sources moved and another one had not followed yet: direction, gap, how long the window stayed open and how many sources lagged. Signals are drawn on the tick chart too, and the chart now shows all sources on one price level.
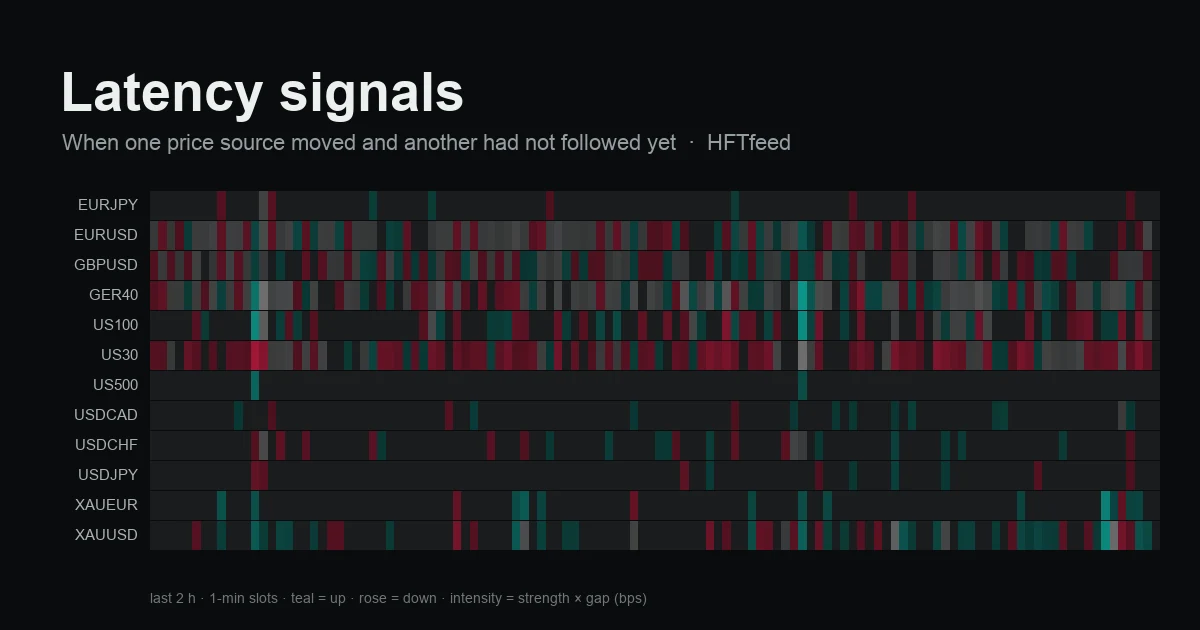
There is a new section in your account: Signals. A signal is the moment our published price has moved and at least one of the other price sources behind it is still quoting the old price. Every signal shows which way the price went, how big the gap was, how long it stayed open and how many sources lagged. You see them live, and you can go back through the last 30 days.
What a signal is
We watch every source we take prices from. A signal fires when two things are true at once:
- Our published price moved at least 3 times its own typical spread.
- Another source has not followed: it is behind by at least that much, and by at least 2 times its own spread, so a gap that is only the source's spread never counts.
There is one signal per move on a symbol. It stays open while the slow sources catch up, for at most 300 ms, and then closes with the reason: all sources caught up, the window ran out, or the move faded or reversed. If a source is still on its old price when the window closes, we keep watching it for up to 5 seconds and record when the gap finally closed.
Nothing is delayed or batched. A signal is detected in our London (LD4) server in microseconds, on the same tick that triggered it.
What each signal tells you
| Field | Meaning |
|---|---|
| Direction | ▲ the price moved up, ▼ down |
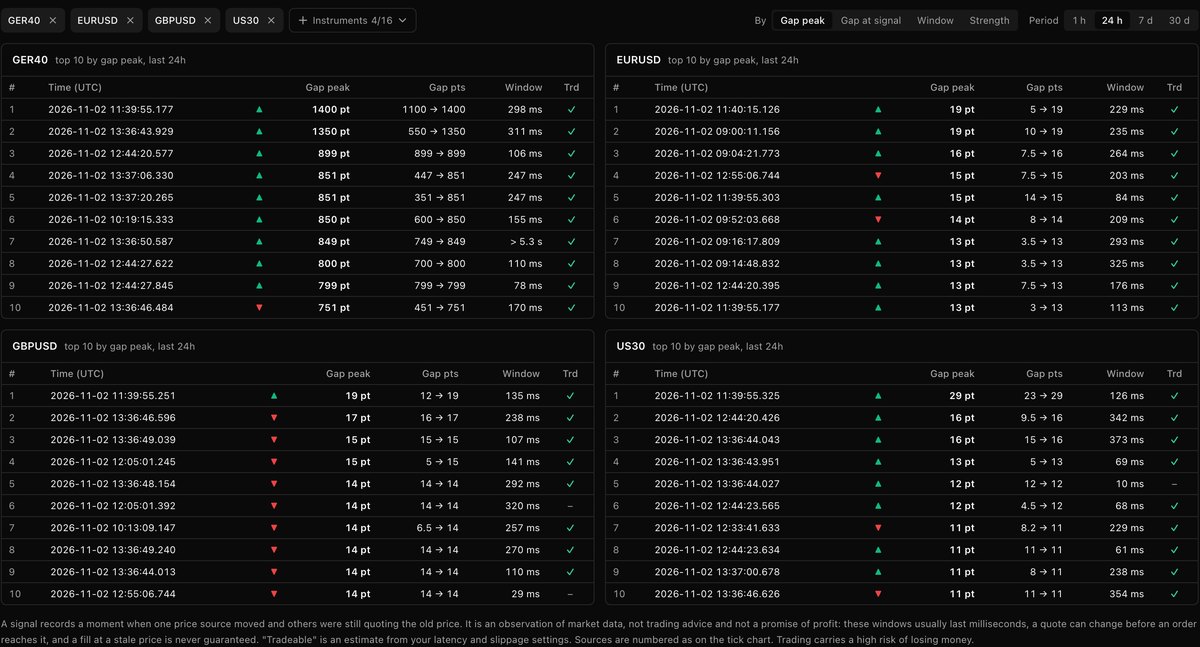
| Gap | The gap when the signal fired and the largest it reached, in points |
| Gap window | How long the gap stayed open: from the signal until the slowest source caught up |
| Strength | How many live sources lagged, for example 2/7 |
| Price at signal | Our published bid and ask at that moment |
| Outcome | All caught up, window cap, faded or reversed |
Sources are numbered the way they are on the tick chart: Source 1, Source 2 and so on, in the order the symbol uses them.
Five views
- Overview: every symbol in one table, with an ON / OFF light that says whether the last 15 minutes looked tradeable at your own execution speed (see below), the best hour of the day, when signals cluster through the week, how long gap windows last, and which source tends to be slowest.
- Live: new signals as they happen, with filters for direction, strength, gap size and gap window.
- Explorer: any signal from history, on a tick chart centred on it, with ← and → to step to the previous and next one. Each signal has its own link you can share.
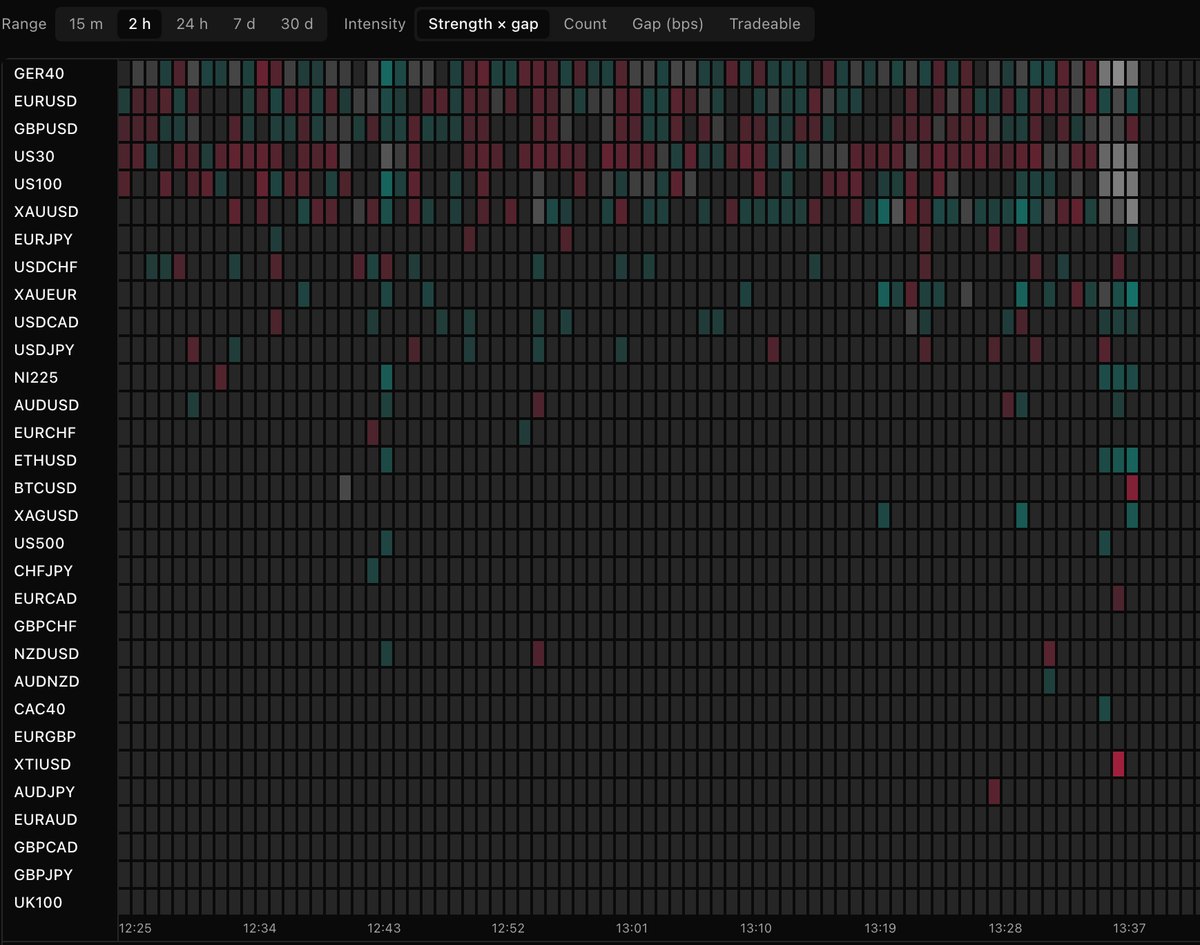
- Heatmap: one row per symbol, one column per time slot, coloured by direction and intensity. From the last 15 minutes in 5-second slots up to 30 days in 4-hour slots.
- Best: the biggest, longest and strongest signals per symbol for the last hour, day, week or month.
Your execution settings
Whether a signal could have been traded depends on how fast your orders reach the broker and what they cost you. Set both once, under Execution in the Signals pages (we start you at 50 ms and 0.1 bps of slippage per side), and every view uses them:
- A signal counts as tradeable when at least one source stayed on its old price longer than your execution time, and its gap was bigger than that source's spread plus your slippage on the way in and out.
- The ON / OFF light turns on when a symbol has had at least three tradeable signals in the last 15 minutes and its windows are, in the middle, longer than your execution time. It goes off when the windows get shorter than your execution time or the gaps fall below your costs, and the reason is shown next to it.

Signals record differences between price sources. They are an observation of market data, not a trading recommendation, and a quote can change before an order reaches it.
On the tick chart
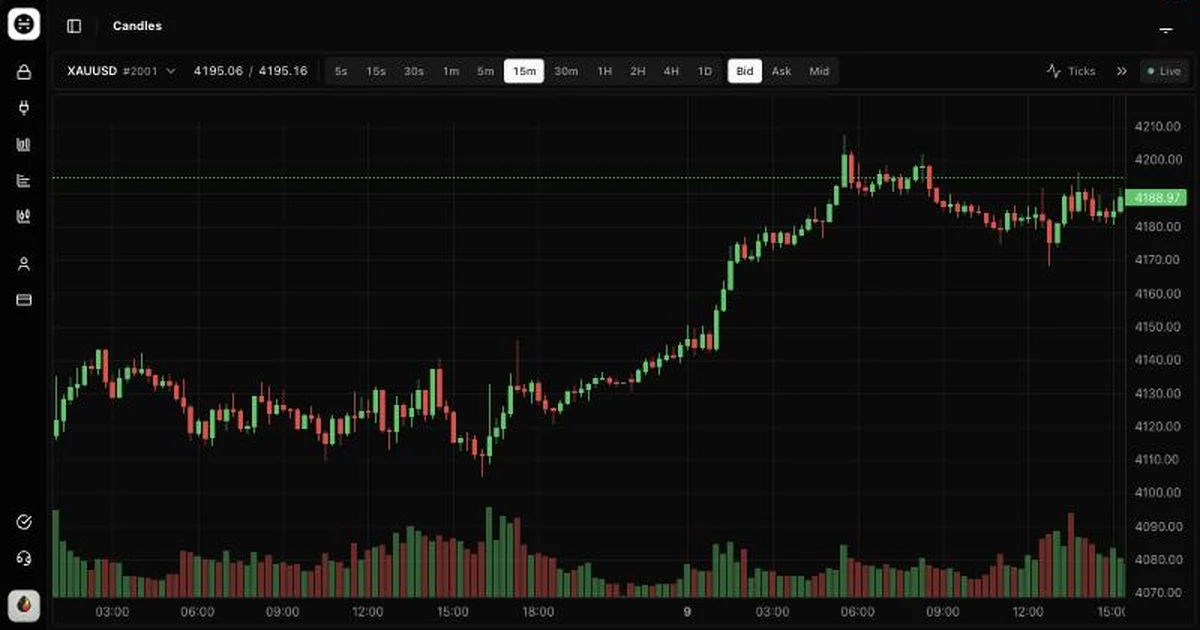
Signals are drawn on the tick chart as well: a shaded band for the window and an arrow labelled with the gap, the window and the strength. A Signals switch in the toolbar turns them on and off. The chart loads its ticks first and the signals right after, and new ones appear as they happen.
All sources on one price level on the chart
Sources quote the same instrument at slightly different levels: an index CFD built on the futures price sits a few dozen points away from one built on cash, and brokers mark up differently. The server now learns each source's offset against the first source of the symbol and draws every source on that level, so the lines on the tick chart overlap the way the market actually moves.
This is a chart view. The feed itself does not change: every tick of our primary source is published the moment it arrives, at its own price. A new source appears on the chart once its offset has been learned, about a minute after it connects, and the learned offsets survive a restart of the server.
Two smaller chart changes come with it:
- A line only breaks when its source is down. A source that is connected but whose price has not changed simply holds its last price, however long that takes.
- A source that is still learning its offset shows "waiting" instead of a price at the wrong level.
How far back
| Data | Kept |
|---|---|
| Signals | 30 days |
| Ticks (tick chart, Explorer charts) | 7 days |
A signal older than 7 days still opens in Explorer, with all its numbers, but without the ticks around it.