Candles: the feed as OHLC, from 5 seconds to a day
A new Candles page turns the published feed into candlesticks in eleven timeframes, with tick volume, a live forming bar and up to a year of history. Plus what else changed since September: the 24-hour trial, fixed spreads and HFTFeed.Client 1.1.3.
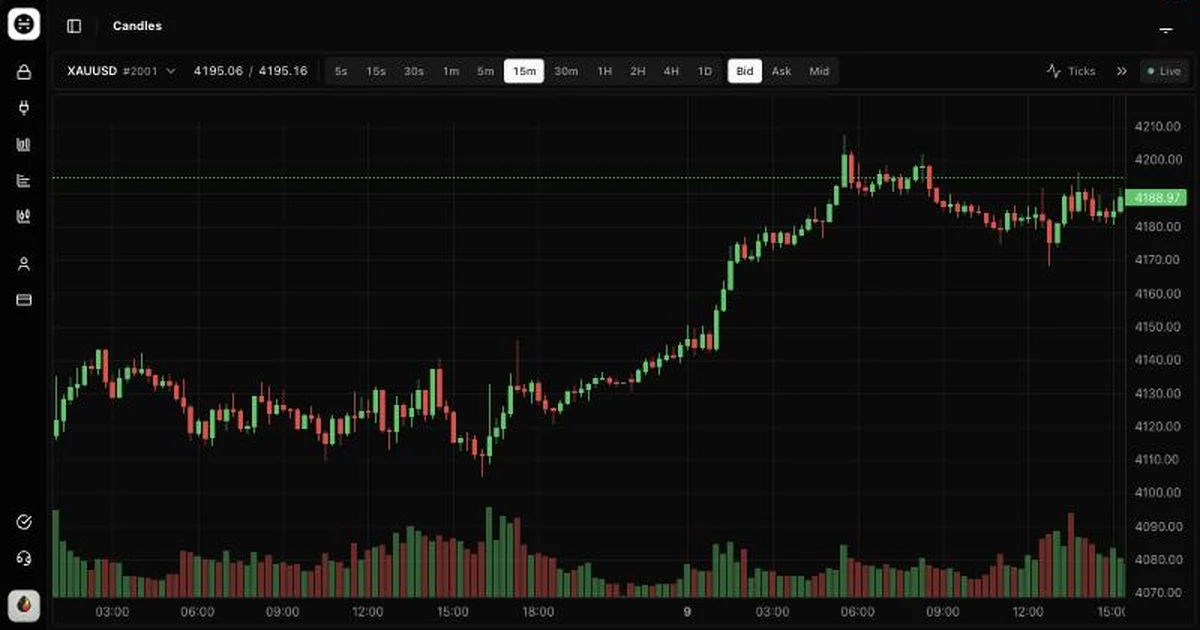
There is a new page in your account: Candles. It draws the same prices your FIX session receives as candlesticks, in eleven timeframes, with a volume strip underneath. It sits next to the tick chart in the menu and needs nothing more than a plan in force, a trial included.
What it shows
- Eleven timeframes: 5s, 15s, 30s, 1m, 5m, 15m, 30m, 1H, 2H, 4H and 1D.
- Bid, ask or mid. Both sides are stored as full OHLC, so switching is instant and the ask candle is the real ask, not the bid shifted by a spread.
- Volume is the tick count: how many prices we published inside the bar. We do not see traded size, so we do not pretend to.
- The bar that is forming moves live, about once a second, and closes on its own. No refresh.
- Scroll back and it keeps going. Older bars are fetched in the background before you reach the edge.
Every symbol on the symbol list has candles, all 45 of them.
What a candle is made of
One rule: a candle is built from the prices we published, the ones that went out on the wire, and from nothing else. Open is the first published price in the bar, close the last, high and low the extremes, volume the count. If you rebuild a bar from your own FIX log you should get the same numbers, give or take a tick that lands exactly on a bar's edge.
A bar with no published price does not exist. We do not draw flat candles through a quiet minute or a closed market, so on a slow symbol a 5-second chart has gaps, and that is the honest picture.
The trading day starts at 17:00 New York
The 1D, 4H and 2H candles follow the FX convention: the day rolls at 17:00 New York, not at midnight UTC. That gives five full daily candles a week, with Sunday evening's first hours belonging to Monday's candle, the way most FX platforms draw it. In UTC the roll is 21:00 in summer and 22:00 in winter; the 4H bars count from there (21:00, 01:00, 05:00 and so on in summer).
For everything except crypto, candles pause from Friday 17:00 to Sunday 17:00 New York. Crypto trades through the weekend and has candles for every day of it.
How far back
| Timeframes | History kept |
|---|---|
| 5s, 15s, 30s | 7 days |
| 1m and longer | 1 year |
The history starts in early October 2026, so the longer timeframes fill in as the weeks pass. The first week was rebuilt from our stored ticks, which keep price changes only; its volume therefore reads a little lower than the live bars that follow, which count every published price.
For anything finer than five seconds, the tick chart is still the place: every published tick, and each source behind it, for the last seven days.
Also new since September
- A 24-hour trial for $50. Three symbols (EURUSD, GBPUSD and XAUUSD) over the real FIX connection, starting from your first logon. The $50 is credited toward your first plan if you subscribe within seven days of the trial ending. Start one from the trial page.
- HFTFeed.Client 1.1.3 is on NuGet. It accepts trial accounts; 1.1.2 refused them before opening a connection. If you are on a paid plan, nothing changes for you.
- Fixed published spreads. Each symbol is now published with a fixed spread, so a wide moment upstream no longer reaches your session.
- Yearly and lifetime plans joined the monthly one. The monthly price is $300 today and $499 from 1 November 2026; the details are on the pricing page.
- A daily feed report by e-mail: how many prices we took in and published the day before.
- Support chat on every page, bottom right. It reaches the same people as the support form.
- Sign-up confirmation links that hung on "loading" for some browsers are fixed.
Not yet
Candles are on the website only. There is no public candle API for your own code yet; if that is something you would use, tell us through support, because it decides what we build next.
Try it
Open Candles, pick a symbol and a timeframe. The Ticks button in the toolbar jumps to the tick chart for the same symbol, and back.